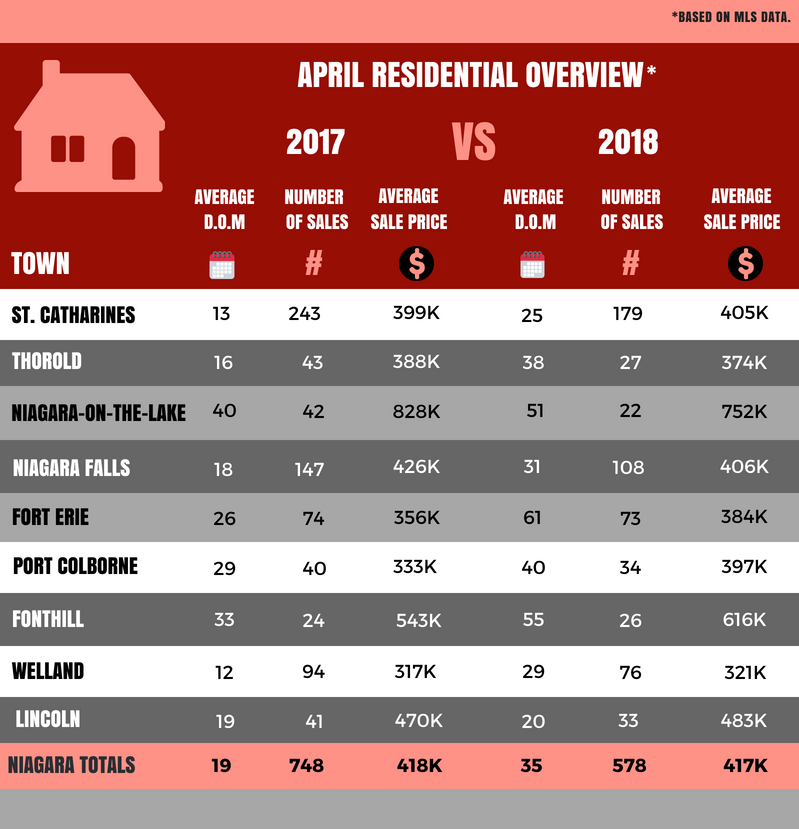
There was a bit of a delay in the monthly stats over the last few months. Data keeps changing constantly and we wanted a fresh look to the Salisbury Stats page. Here is a look at April 2018 versus April 2017.
Notice a trend?
Average Sale Price in 30% of the areas are actually down from 2017! Houses are taking approximately 50% longer to sale ( D.O.M – Days on market) and the number of sales overall are approximately down 23% .
What does that mean? For sellers, the listing price we set has to be more accurate than before and for buyers, finally a little more selection to choose from since January 2016.
As always, any questions, don’t hesitate to ask!
As always, any questions, don’t hesitate to ask!